Classes and Scalar Information
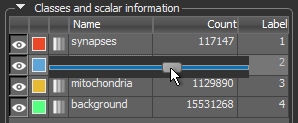
The Classes and scalar information box, shown below, indicates the name of each class in the multi-ROI, the number of labeled voxels, and the color assigned to each class. If available, you can also view scalar information related to each class. You can show or hide any class by toggling the visibility control, as well as set a class as the background. In addition, a Pick tool is available for visually selecting a class in a view.
Classes and scalar information

The following items and options are available in the Classes and scalar information group box for a selected multi-ROI:
| Description | |
|---|---|
| Visible | Lets you show or hide the colored highlight applied to the labeled voxels within a class. |
| Color |
Is the color of the highlight that is applied to the labeled voxels within a class.
Note The opacity of the highlight is adjustable with the slider in the Opacity box. |
| Opacity |
Lets you adjust the opacity of each labeled class independently. Click the Opacity icon in the classes list to open the Opacity slider, as shown below.
You can then adjust opacity from 0 to 100 percent with the slider.
Note Whenever you change the opacity of a class, the global opacity settings selected in the Opacity and color box will not be applied. However, you can right-click a class with an individually set opacity and then choose Use Global Opacity in the pop-up menu to reinstate the global opacity settings. |
| Name | Is the name assigned to a class. |
| Count | Is the total number of labeled voxels in a class. |
| Label | Indicates the label number assigned to each class or the selected scalar information (see Scalar Information). |
| Pick |
Lets you visually select a multi-ROI class or multiple classes by picking in a 2D
|
| Add |
Lets you add one or more classes to the multi-ROI as follows:
Add Class… Automatically adds a new class to the multi-ROI. Add Multiple Classes… Lets you choose the number of classes to add to the multi-ROI. |
| Remove | Deletes the selected class. |
| Merge |
Merges the selected classes.
Note The class name and color of the merged class are whose associated with the class you selected first and that is identified as 'A'. |
| Background class | If enabled, labeled voxels that are removed from any class, as well as unlabeled voxels that are painted, will be added automatically to the set background class (see Setting a Class as the Background). |
| Labeled voxels count | Indicates the number of labeled voxels in the selected class. |
| Scalar information | Measurements that were computed for the selected multi-ROI, imported from a file, or copied from another object, are available in the Scalar information group box (see Scalar Information). |
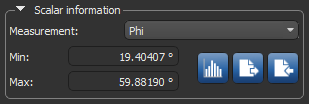
Any scalar information that is available for a multi-ROI can be selected in the Scalar information box on the Data Properties and Settings panel, as shown below, and can be further evaluated with the Measurement Inspector (see Examining Multi-ROIs with the Measurement Inspector). You can also generate, import, map, and copy scalar values to multi-ROIs, as well as export scalar values.
Scalar information box
| Description | ||
|---|---|---|
| Measurement | - |
Indicates the current measurement that is selected and mapped in the view of the multi-ROI. Scalar information for a multi-ROI can be generated in the Compute Measurements dialog (see Computing Measurements for Multi-ROIs).
Min… Indicates the minimum value of the currently selected measurement. Max… Indicates the maximum value of the currently selected measurement. You should note that the Label measurement refers to the identifier assigned to each labeled component in the multi-ROI and that the maximum value may not be equal to the label count. For example, if you have merged, split, or deleted objects. The label count is always the total number of labeled components in the multi-ROI. |
| Histogram |
|
Lets you plot the distribution of a selected measurement and extract basic measurements, such as the minimum, maximum, mean, and standard deviation value of the selected measurement (see Analyzing Histograms and Creating Classes ). |
| Export |
|
Lets you export selected scalar values to a comma-separated values (*.csv extension) file (see Exporting Scalar Values from Multi-ROIs). |
| Import |
|
Lets you import scalar values from a comma-separated values (*.csv extension) file (see Importing Scalar Values from CSV Files). |
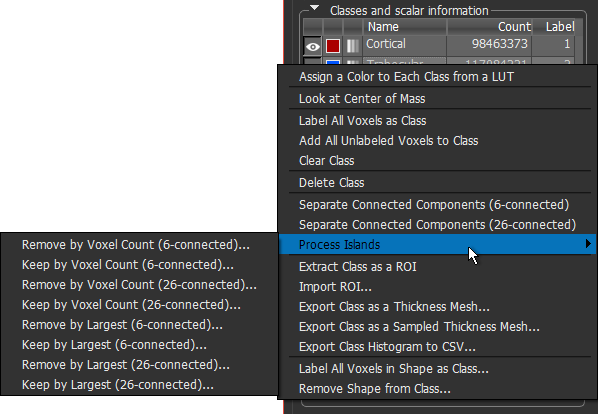
In addition the operations available for labeling and editing classes (see Labeling Multi-ROIs), a number of additional options are available in the Classes and Scalar Information pop-up menu for automatically labeling voxels, importing and extracting regions of interest, as well as merging and deleting classes.
Classes and Scalar Information pop-up menu
The pop-up menu items available for single and multiple selections are described below.
| Description | |
|---|---|
| Assign a Color to Each Class from a LUT |
Lets you automatically assign colors to each class from a selected LUT.
Note This option is not available if scalar information is selected for the multi-ROI. |
| Look at Center of Mass |
Automatically aligns the center of mass of the labeled voxels of the selected class(es) in the center of the current 2D scene view Note The center of mass is calculated from the bounding box of the labeled voxels within the selected class(es). |
| Label All Voxels as Class |
Automatically labels all voxels in the multi-ROI as the selected class.
Note In this case, all voxels previously labeled as other classes will be removed. |
| Add All Unlabeled Voxels to Class | Automatically adds all unlabeled voxels to the selected class. |
| Clear Class(es) | Removes all labeled voxels from the selected class or classes. |
| Delete Class(es) | Deletes the selected class or classes. |
| Merge Classes* | Merges the selected classes.
Note The class name and color that are retained are whose associated with the first selected class. |
| Swap Classes** | Swaps the Label index of the selected classes. |
| Separate Connected Components |
Lets you separate the connected components within a selected class or classes based on connectivity. In image processing, connectivity is the way in which pixels in images relate to their neighbors and are labeled as separate components. You should note that a set of pixels in an image that are connected to each other is often called a connected component. 6‐connected… Propagation is done by strictly using the 6 faces adjacent to the current seed and will result in the minimum number of connected pixels. 26‐connected… Propagation is done by strictly using the 6 faces, 12 edges, and 8 corners adjacent to the current seed and will result in the maximum number of connected pixels. Note In either case, each separated component will be assigned to a new class. |
| Process Islands |
In cases in which you need to refine threshold segmentation results or need to isolate objects of a certain size, you can remove small objects from a selected class, as well as isolate larger objects (see Processing Islands). These operations can be based on voxel counts or by rank.
Note Components with an identical voxel count are considered as unique objects when they are ranked. |
|
Extract Class as an ROI Extract Each Class as an ROI* |
Creates a new region of interest that contains the labeled voxels of the selected class or creates new regions of interest that contain the labeled voxels of the selected classes. |
| Import ROI |
Lets you modify the labeled voxels within the selected class as follows:
Add to class… Adds the labeled voxels of the selected region of interest to the class. Overwrite class… Replaces the labeled and unlabeled voxels of the class with the labels of the selected region of interest. Remove from class… Removes the labeled voxels of the selected region of interest that intersect with the labeled voxels of the class. Intersect with class… Keeps only the labeled voxels of the selected region of interest that intersect with the labeled voxels of the class. |
| Export Class(es) as a Thickness Mesh |
Lets you export a selected class or classes as color-coded thickness mesh that shows referential values of the local thickness between boundary points. Thickness is calculated as the diameter of a hypothetical sphere that fits within each boundary point (see Exporting ROIs and Multi-ROIs to Thickness Meshes).
Do the following if you need to apply smoothing prior to exporting the mesh:
When processing is complete, the exported thickness mesh will appear on the Data Properties and Settings panel. Thickness meshes can be examined in 2D and 3D views. |
| Export Class(es) as a Sampled Thickness Mesh |
Lets you export a selected class or classes as color-coded thickness mesh that shows referential values of the local thickness between boundary points. In this case, you can select the required sampling values for the X, Y, and Z axes in the Export as Sampled Thickness Mesh dialog. Thickness is calculated as the diameter of a hypothetical sphere that fits within each boundary point.
Do the following if you need to apply smoothing prior to exporting the mesh:
When processing is complete, the exported thickness mesh will appear on the Data Properties and Settings panel. Thickness meshes can be examined in 2D and 3D views. |
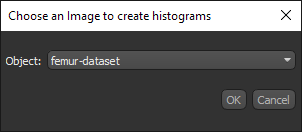
| Export Class(es) Histogram(s) to CSV |
Lets you export histograms of labeled data in the comma-separated values (*.csv extension) file format. In this case, the data associated with each label will appear in a separate row and the number of pixels in each bin will appear in the columns.
You can then choose the image to extract the values for the histograms in the Choose an Image to Create Histograms dialog, shown below.
Note You can select up to a maximum of 1000 labels for exporting label histograms to CSV. |
| Label All Voxels in Shape as Class |
Lets you label all of the voxels in a shape, as follows:
|
| Remove Shape from Class |
Lets you clear all of the labeled voxels that intersect with a shape, as follows:
|